
A polygenic score method boosted by non-additive models
Published in Nature Communications, 2024
We developed GenoBoost, a polygenic score modeling approach, incorporating both additive and non-additive genetic dominance effects. The MIT CSAIL News article provides a fantastic summary of our work.
Abstract
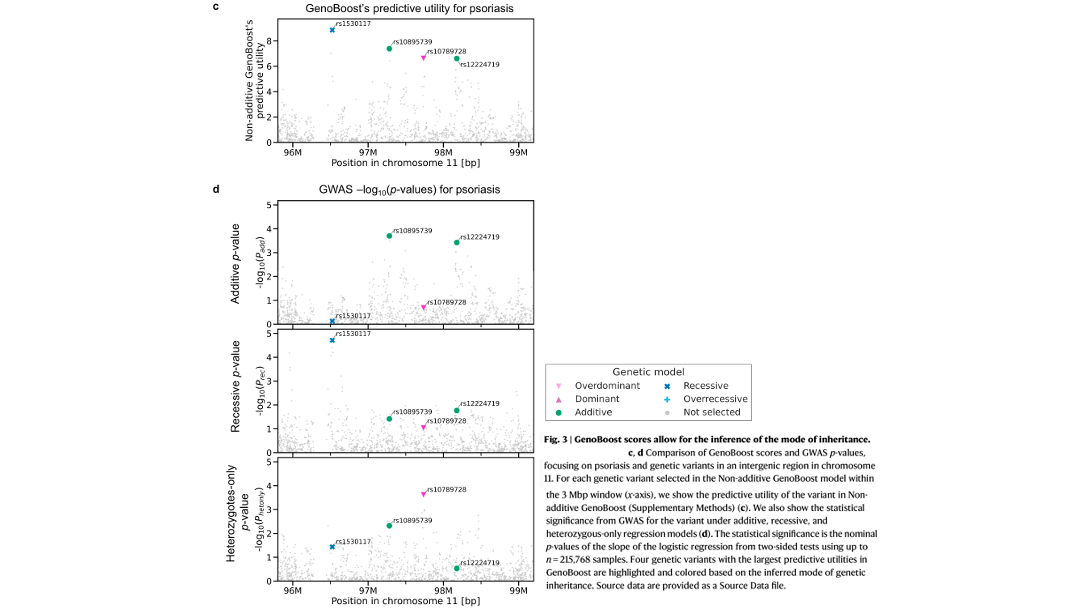
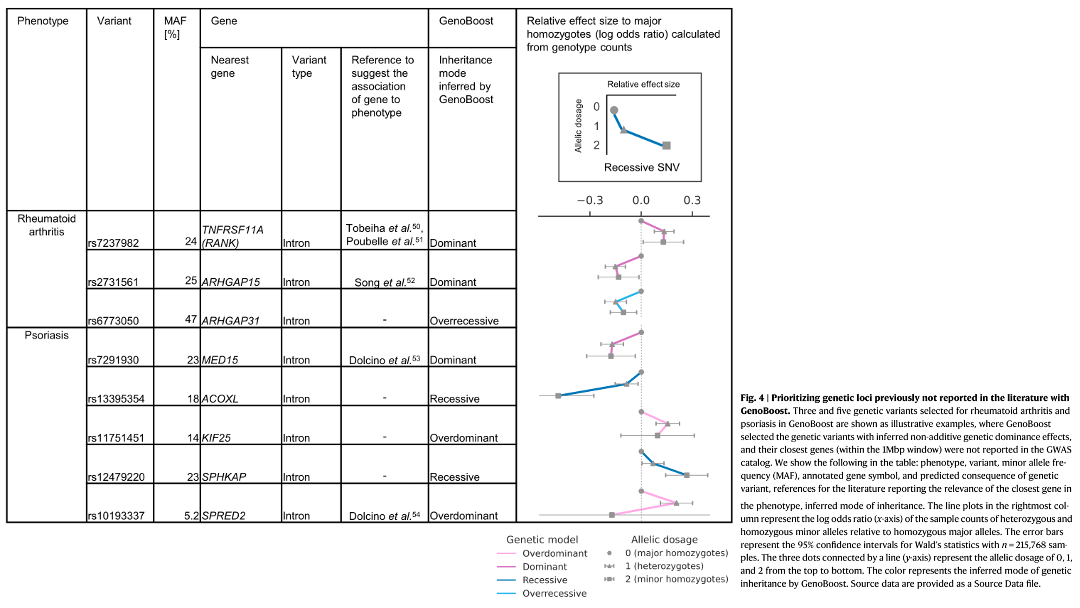
Dominance heritability in complex traits has received increasing recognition. However, most polygenic score (PGS) approaches do not incorporate non-additive effects. Here, we present GenoBoost, a flexible PGS modeling framework capable of considering both additive and non-additive effects, specifically focusing on genetic dominance. Building on statistical boosting theory, we derive provably optimal GenoBoost scores and provide its efficient implementation for analyzing large-scale cohorts. We benchmark it against seven commonly used PGS methods and demonstrate its competitive predictive performance. GenoBoost is ranked the best for four traits and second-best for three traits among twelve tested disease outcomes in UK Biobank. We reveal that GenoBoost improves prediction for autoimmune diseases by incorporating non-additive effects localized in the MHC locus and, more broadly, works best in less polygenic traits. We further demonstrate that GenoBoost can infer the mode of genetic inheritance without requiring prior knowledge. For example, GenoBoost finds non-zero genetic dominance effects for 602 of 900 selected genetic variants, resulting in 2.5% improvements in predicting psoriasis cases. Lastly, we show that GenoBoost can prioritize genetic loci with genetic dominance not previously reported in the GWAS catalog. Our results highlight the increased accuracy and biological insights from incorporating non-additive effects in PGS models.
Highlights
Polygenic score, a statistical approach to predicting heritable traits and the genetic liability of disease, has received increasing research interest.
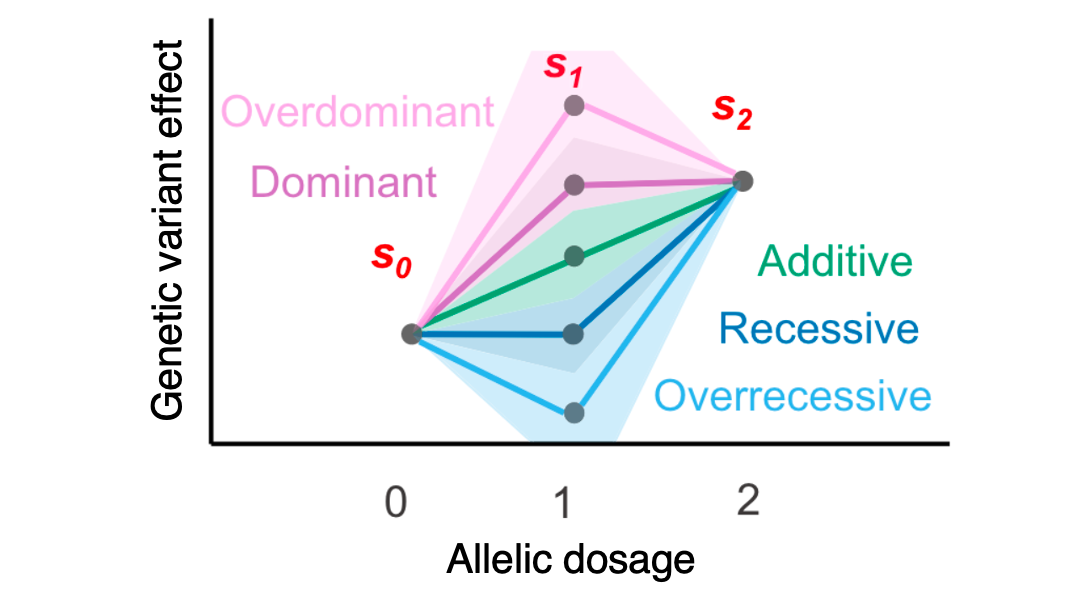
Genetic dominance refers to deviations from linear additive effects of genetic variants on phenotypes. It is observed, for example, in the ABO blood group system. However, they are typically not considered when predicting complex traits with polygenic scores.
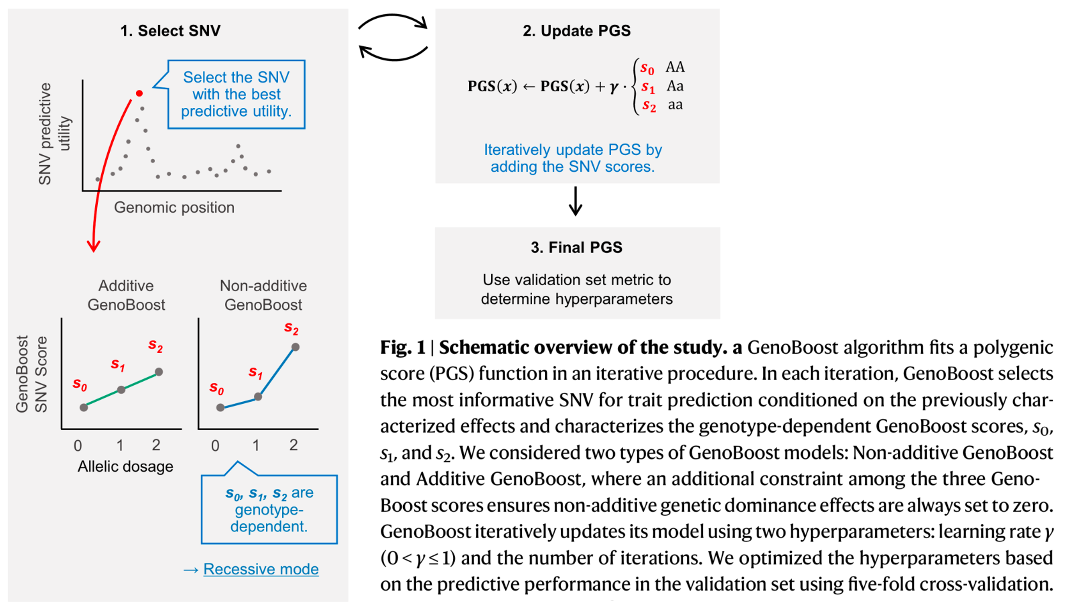
We hypothesized that using individual-level data and statistical boosting would allow us to incorporate non-additive genetic dominance effects directly into PGS. Rikifumi (Ricky) Ohta developed GenoBoost, an efficient implementation backed with provably optimal scores.
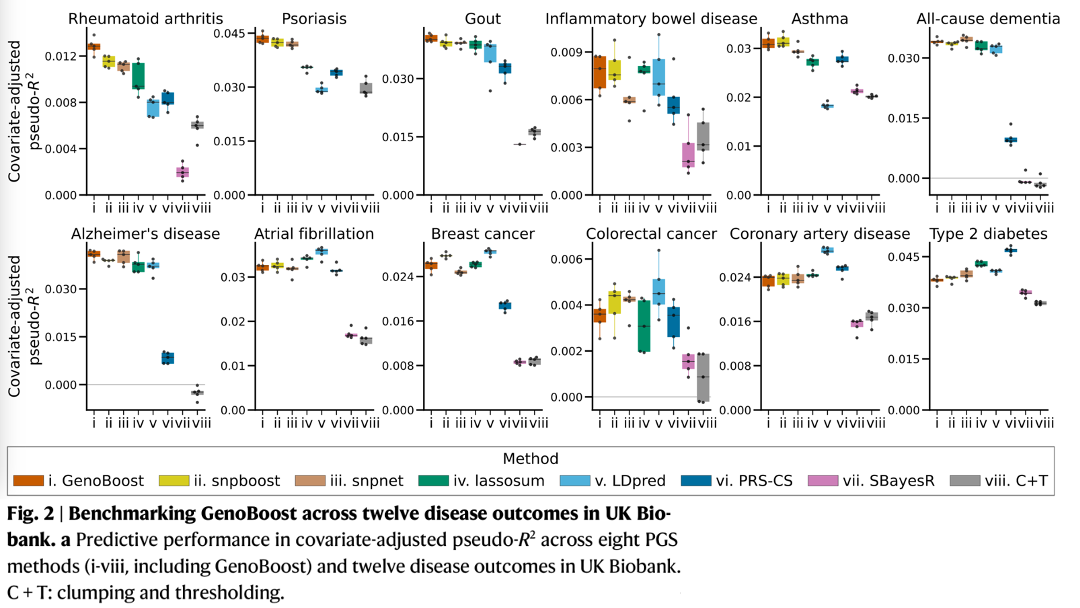
Applying to a panel of 12 disease outcomes in UK Biobank, we demonstrate the competitive predictive performance of GenoBoost against seven published methods.
Looking into genetic variant effects captured in the predictive models, we found that GenoBoost incorporates non-zero dominance effects in 40-67% of variants. We validated the genetic dominance effects in GenoBoost using an orthogonal approach based on GWAS.
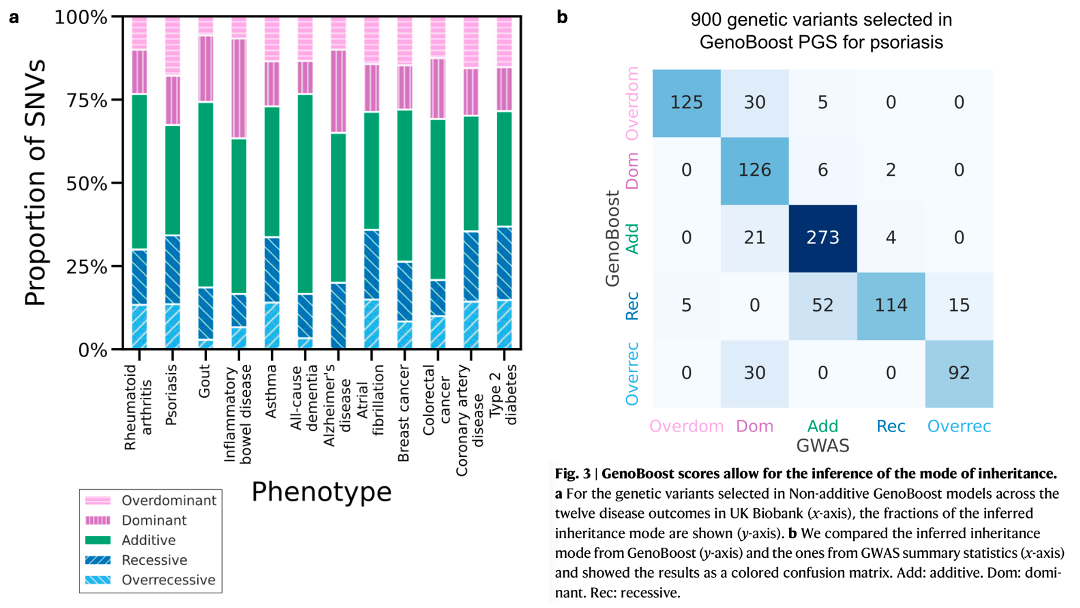
In some genomic loci, GenoBoost selects genetic variants with different modes of genetic inheritance, highlighting the ability of GenoBoost to integrate additive and non-additive genetic dominance effects.
We also propose GenoBoost as a tool for prioritizing genomic loci with non-additive genetic dominance effects and highlight some examples.
The research was conducted as an integral part of Ricky’s @ricky_ota Ph.D. thesis, which he recently defended and for which he received the degree 🎉. Thank you, Prof. Morishita, Rikifumi (Ricky) Ohta, Dr. Suzuki, and Manolis, for the wonderful collaborative opportunity.
Data and Code availability
The software and PGS score models are publicly available on GitHub and the PGS catalog. Please check them out!
Links
- Ohta*, Tanigawa*, Suzuki, Kellis, and Morishita. A polygenic score method boosted by non-additive models. Nature Communications 15, 4433 (2024).
- MIT CSAIL News article
- Twitter/X summary:
日本語での解説 (Highlights in Japanese)
ポリジェニック・スコアは、疾患の遺伝的リスクやその他の複雑形質を、遺伝的要因から予測する統計的な手法で、近年注目を集めています。
さまざまな遺伝効果のうち、「顕性遺伝(優性遺伝)」「潜性遺伝(劣性遺伝)」など、加法的な効果のみで説明できない遺伝様式があり、ABO血液型の例などが知られています。しかし、これらの非加法的な効果は、従来のポリジェニック・スコア研究では考慮されていませんでした。
私たちは、統計的ブースティングという機械学習の手法を用いて個人レベルのデータを解析することで、ポリジェニック・スコアに顕性遺伝の効果を組み込むことができるのではないかと考えました。Rikifumi (Ricky) Ohta さんが、数理的な証明に基づく効率の良いアルゴリズムとしてGenoBoost を実装しました。
UK Biobank のコホートにある12の疾患形質に着目して、疾患の遺伝的リスクの予測性能を評価したところ、私たちの GenoBoost は、既存の7つの手法と比較して、同等やそれ以上の良い精度を示すことがわかりました。
得られた予測モデルに含まれる遺伝的変異の効果を解析したことろ、 GenoBoost に選択された40-67%の遺伝子変異が、非ゼロの顕性遺伝の効果を示すことがわかりました。GenoBoost における顕性遺伝の効果を、GWAS の手法によって検出される効果と比較することで、検証しています。
GenoBoost を用いることで、同じゲノム領域に含まれる、異なる遺伝様式の遺伝子変異を予測モデルに統合することができます。実際、このような例を論文では紹介しています。
GenoBoost を、顕性遺伝の効果をもつ、興味深いゲノム領域を探索するツールとして使うことを提案し、いくつかの具体例を示しました。
GenoBoost のソフトウェアや、論文にて報告したポリジェニックコアのモデルは、 GitHub や PGS catalog にて公開しています。ぜひ、活用してみてください。
本論文は、太田さん の博士論文の中核をなす研究成果です (ご卒業・学位取得おめでとうございます🎉)
最後になりましたが、共同研究の機会をいただいた森下先生、太田さん、鈴木先生、@manoliskellis 先生たち共著者のみなさまに感謝を述べて、解説🧵の結びとします。
Reference: Ohta*, Tanigawa*, Suzuki, Kellis, and Morishita. A polygenic score method boosted by non-additive models. Nature Communications 15, 4433 (2024). https://doi.org/10.1038/s41467-024-48654-x